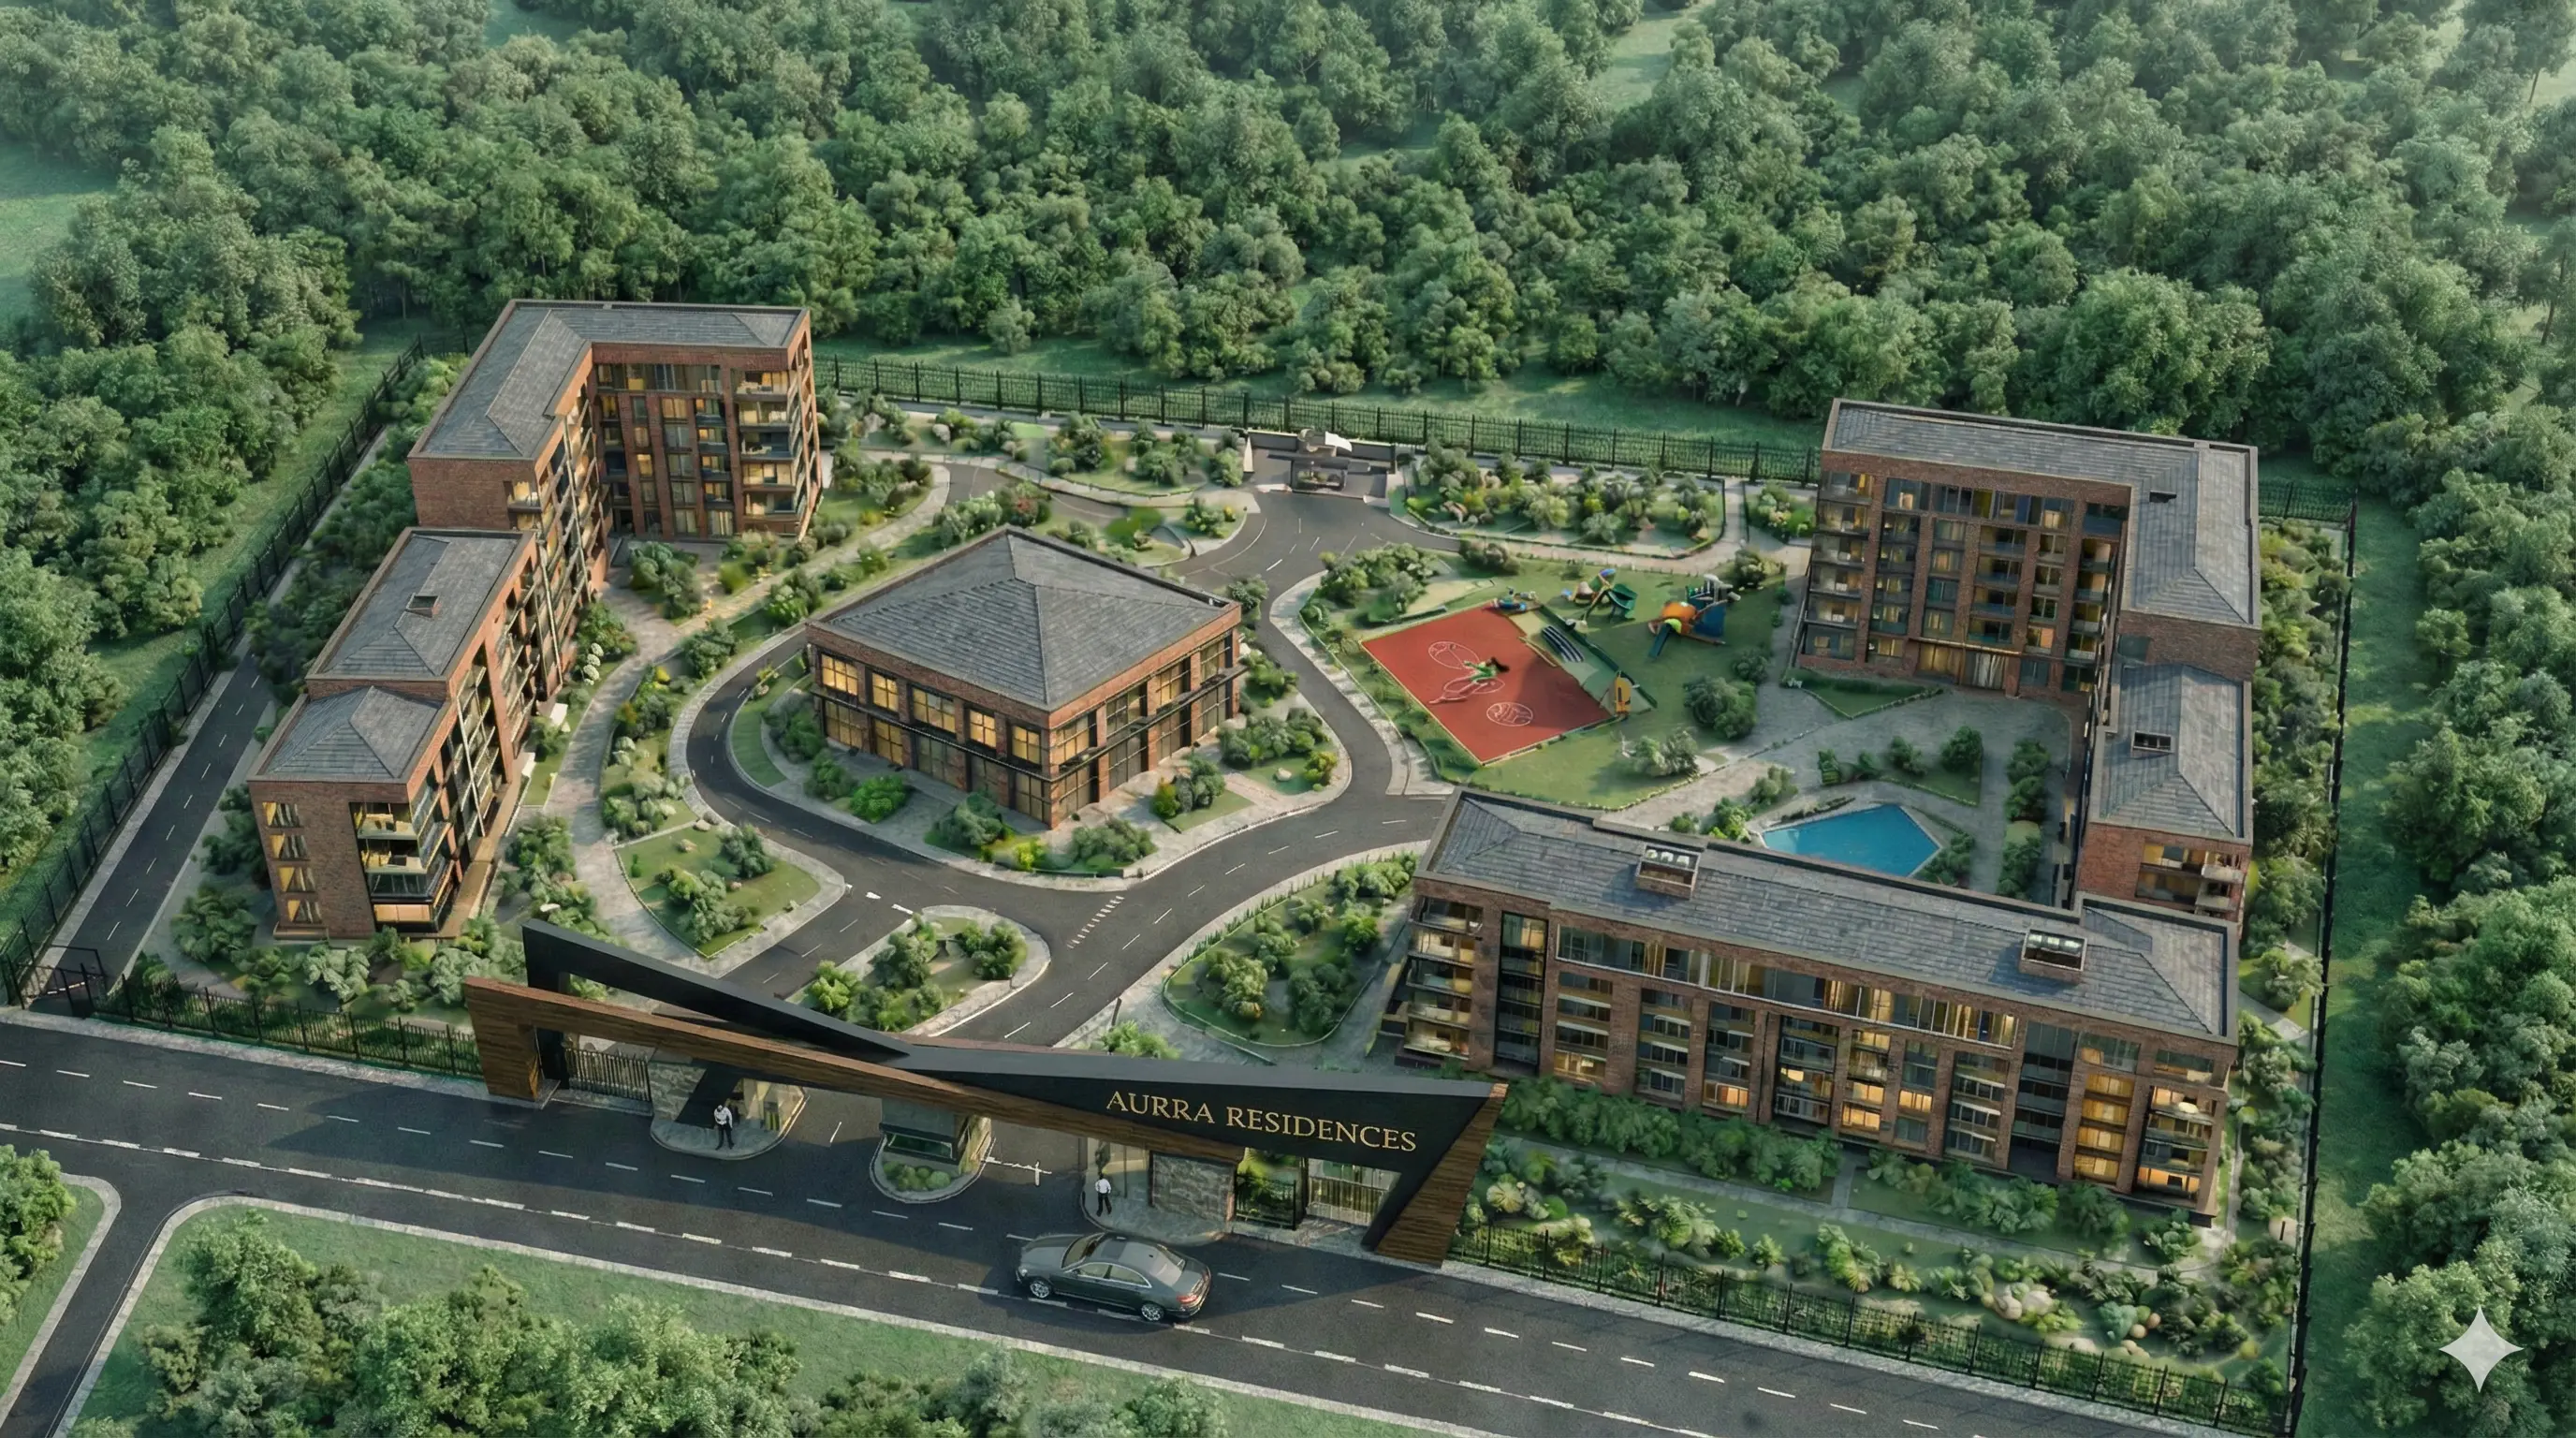
Aurra Residences is the first modern gated residential community in the Sighnaghi corridor — built on the land already owned, in a market where 900 families are actively looking for a modern home and supply is non-existent.
The Sighnaghi region is one of Georgia's fastest-growing corridors — powered by wine exports, national tourism, and a rising professional class. Yet its housing stock is almost entirely Soviet-era and traditional. There is no institutional-grade gated community in the entire region. Aurra is being built to fill that gap.
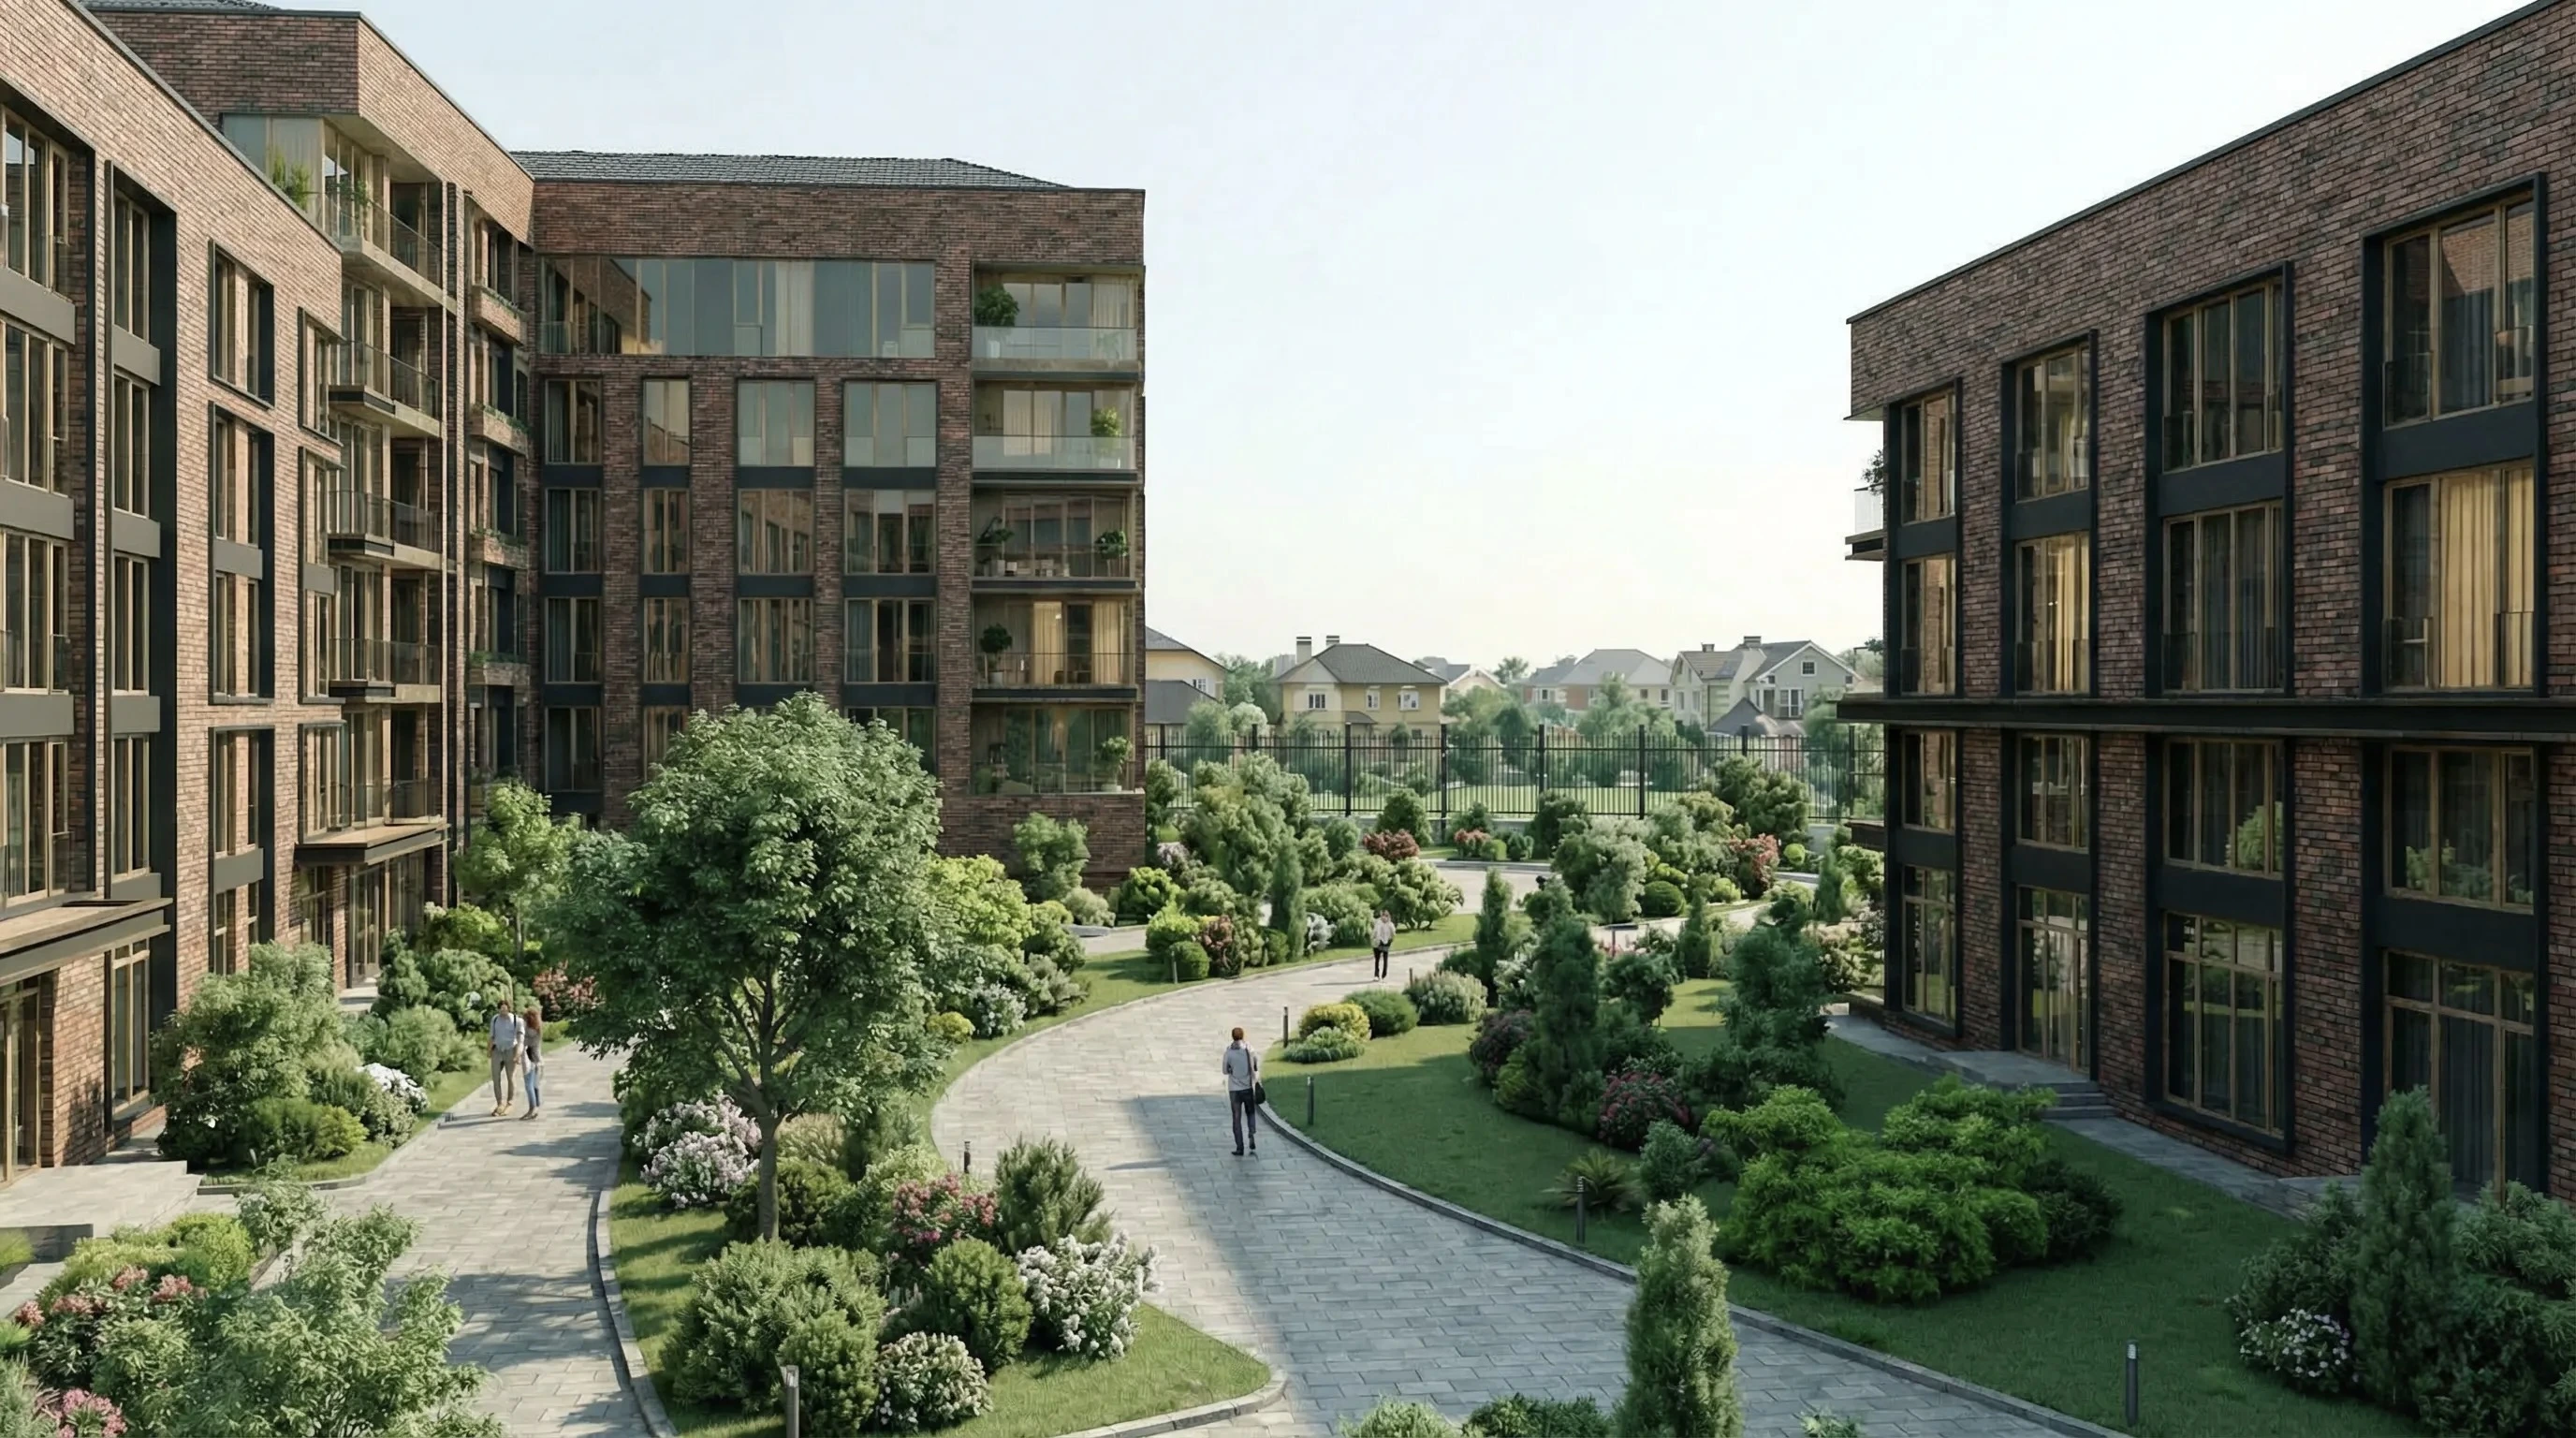
Set on 10,000 sqm of land parcel with open views across the Alazani Valley and the Caucasus mountains, Aurra Residences will deliver 300+ modern apartments across three carefully phased towers — each one complemented by a residents-only amenity hub designed to make daily life genuinely convenient, comfortable, and connected.
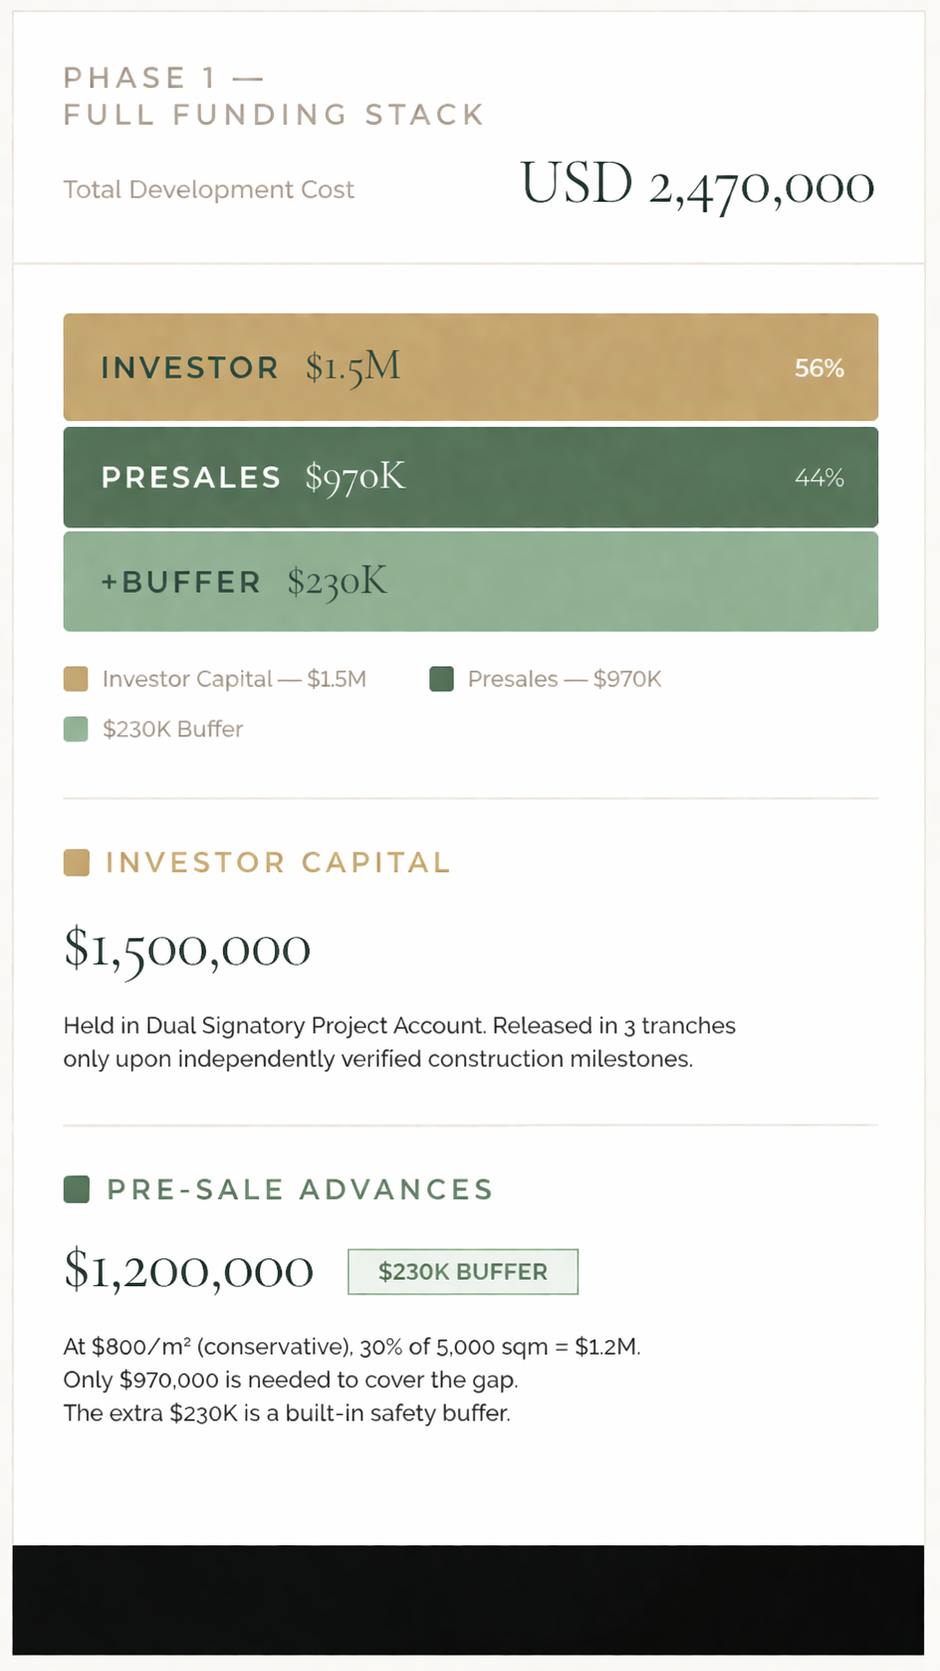
We are currently inviting select investors to participate in Phase 1 to raise $1.5M. The land is owned.
Sighnaghi is Georgia's most recognised regional town — the "City of Love," a UNESCO-listed fortress city, and the gateway to the Alazani Valley wine region. It draws 300,000+ tourists annually, sits 2 hours from Tbilisi, and is home to a stable permanent population of 18,000 residents whose incomes have grown 14.2% year on year. Yet despite this growth, the entire region has zero institutional-grade residential developments. The housing stock is 95% Soviet-era or traditional. Aurra would be the first.
95% of existing housing is obsolete or structurally deficient.
Zero institutional-grade gated communities exist.
Latent demand stands at 900 units.
Current modern supply is non-existent.
Wine & Agriculture - Kakheti produces over 70% of Georgia's wine. Agriculture is the region's largest employer and provides stable, year-round income that doesn't depend on seasons.
National Tourism - Sighnaghi is a cornerstone of Georgia's $4.4B tourism sector. 300,000+ visitors annually, wine tourism, UNESCO-listed walls — this drives hospitality jobs, retail spend, and short-term rental demand.
Public & Service Sector - Government offices, schools, hospitals, municipal services. A growing middle class of salaried professionals with stable incomes who are the core buyer demographic for Aurra Residences.

The Kakheti region has a housing crisis — not of affordability, but of availability. The regional economy has modernised completely. The housing stock has not moved in 40 years.
The Kakheti region has approximately 60,000 households. 70% — around 42,000 units — are classified as obsolete or structurally deficient. Long-term replacement demand is forecasted at 15,000+ units over the next five years. The current pipeline cannot meet even a fraction of that.
While some residential community development has begun in Telavi — the region's administrative capital, 70 km north — the Sighnaghi corridor has seen none. Not one organized residential development has been delivered, and none is currently under construction.


First-time buyers moving out of Soviet-era or ancestral homes. Seeking security, modern amenities, and independent living. The largest and most urgent buyer group.
Established families and business owners downsizing from large traditional homes. Motivated by low maintenance, energy efficiency, and the prestige of a managed gated environment.
Local and returning expat retirees seeking compact, modern, low-maintenance living with elevators, pharmacies, and walking trails on site.
Affluent Tbilisi professionals seeking a lock-up-and-go weekend retreat. 2 hours from the capital, panoramic mountain views, high-speed internet, 24/7 security.
Following double-digit growth in 2021 and 2022, Georgia maintained a 7.4% GDP growth in 2025— nearly double the average of EU candidate countries. Since 2019 Georgia has been classified by the World Bank as an upper-middle-income country, with real wages and purchasing power rising consistently year on year.

Source: Geostat (National Statistics Office of Georgia)

Between 2018 and 2025 property values in Georgia's key growth corridors surged by over 74%. While Tbilisi drove the first wave, the second wave is now hitting the regions — particularly Kakheti, where improved infrastructure including the new high-speed highway has accelerated both tourist and investor interest. According to Colliers Georgia, in 2025, Kakheti recorded a 19.8% year-on-year rise in real estate transactions — the strongest regional growth in the country, driven by lifestyle migration, tourism expansion, and a structural shortage of modern housing supply. Infrastructure upgrades on the S5 highway and growing resort developments near Kvareli and Lopota Lake, construction of 5 Star Hotel "Bodbe", have triggered initial investor interest, especially around Telavi and Sighnaghi.

The Aurra Project would be developed sequentially - one tower at a time.
Each Tower would represent a separate development phase and would be executed sequentially. Building permit application is currently in progress with the relevant municipal authority. Phase 1 construction capital is released only upon receipt of the building permit — no hard construction funds are deployed before permit confirmation.

Finalization of Architectural plans, submission of permit applications and documents, securing all municipal building permits, establishment of presales office, marketing launch etc. This phase ensures the project is fully "Shovel-Ready."
The presales office opens and unit reservations begin. Buyers pay a 10% booking deposit at reservation, with the balance tied to construction milestones.
Foundation works commence following building permit receipt and independent engineer sign-off. This triggers the release of Tranche 2 construction capital and marks the start of vertical construction.
Structural frame complete to roof level. External walls, roof slab, and building envelope sealed. With the construction risk materially reduced, buyer confidence typically strengthens and sales velocity increases in this phase.
Interior fit-out across all units. MEP, common areas, landscaping completed. Building inspections and occupancy certificate obtained. Unit title transfers commence and handover to residents begins.
Aurra Residences offers three distinct return structures, allowing investors to select the mechanism that best aligns with their risk profile, liquidity requirements, and investment horizon. All options are available at the point of subscription and may be combined.
RECOMMENDED · HIGHEST RETURN
You share directly in Phase 1's net profits. Your capital is returned first, then profits are split according to your investor tier (30%, 35% or 40%). The Stronger the Sale Price, the higher your return. This is the preferred structure for investors seeking maximum upside from the project’s performance.
GUARANTEED · LOWEST RISK
You receive a fixed return per annum regardless of sales performance. Interest accrues quarterly and is paid from sales proceeds as units are sold. Full capital plus all outstanding interest is returned by Month 36 at the latest. This is the preferred structure for investors who prioritise certainty over maximum upside.
FLEXIBLE · BALANCED APPROACH
Investors who wish to combine a cash return with direct ownership of Georgian real estate may allocate their capital in a 50/50 split at subscription. Half of the investment earns cash returns under either Option A or Option B (investor's choice); the other half is used to acquire completed residential units at the pre-agreed investor price of USD 600/sqm — against a retail selling price of USD 900/sqm.
| Option A – Profit Share | Option B – Fixed Annual Return | Option C – Hybrid | |
|---|---|---|---|
| Type | Profit Share | Fixed Return | A or B + Unit allocation |
| Total Value at Exit | $2,310,000 | $1,950,000 | $2,280,000 |
| Net Return on $1.5M investment | $810,000 | $450,000 | $780,000 |
| Annualized Returns | 18% | 10% | 17% |
| Risk Profile | Moderate | Low | Low-Moderate |
| Capital in Cash | Yes | Yes | Partial |
| Term | 36 months | 36 months | 36 months |
| Best For | Return maximisers | Conservative investors | Balanced approach |
| Stress | Moderate | Base Case | Upside | |
|---|---|---|---|---|
| Selling Price | $700/m² | $850/m² | $900/m² | $1000/m² |
| Phase 1 Revenue | $3.5M | $4.25M | $4.5M | $5.0M |
| Phase 1 Profit | $1.0M | $1.75M | $2.0M | $2.5M |
| Anchor Investor Return (40%) | $410,000 profit | $710,000 profit | $810,000 profit | $1,010,000 profit |
| Annualized Returns | 9% | 15.5% | 18% | 22.4% |
"Even in the stress scenario ($700/m² — a 22% discount to base price), the project generates over $1M gross profit. Investor loan principal is returned first from unit sale proceeds. Returns are positive across all scenarios above cost price ($450/sqm). The loan structure and milestone-gated capital release are specifically designed to protect principal throughout."
Three entry tiers — each with differentiated profit share, governance rights, and phase access. The larger your commitment, the stronger your position in the project.
$100,000 — $249,999
PROFIT SHARE
30%
ESTIMATED ANNUALIZED RETURNS
13.5%
INVESTOR RIGHTS
$250,000 — $1,000,000
PROFIT SHARE
35%
ESTIMATED ANNUALIZED RETURNS
15.75%
INVESTOR RIGHTS
$1,500,000
PROFIT SHARE
40%
ESTIMATED ANNUALIZED RETURNS
18%
INVESTOR RIGHTS
"Minimum ticket is $100,000. If total subscriptions exceed $1,500,000, investor allocations will be scaled pro-rata and any excess returned. All return options (A, B, C) are available across all tiers. Complete terms in the Investment Memorandum."
Sighnaghi(Georgia): While major hubs like Tbilisi show yields of 7.5% to 9% in early 2026, high-demand resort regions like Sighnaghi command a premium due to lower entry costs and a massive supply gap.
Dubai (UAE): Mid-market areas like JVC show yields of roughly 7–8%, while prime areas like Dubai Marina have moderated to the 5–6.5% range. Capital appreciation is stabilizing at 5–8% after a 60% surge in previous years.
Pune (India): Luxury rental yields in Pune and Gurgaon are currently benchmarked between 3% and 3.5%. Capital appreciation in high-growth corridors like Pune’s Baner-Hinjewadi belt is strong at 8–12%.
Portugal (Europe): Rental yields in Lisbon's central district have compressed to 3–3.5%, while emerging residential zones reach up to 5%. Appreciation has moderated to roughly 4.5%–7% as the market matures.
| Market Location | Rental Yield (Avg) | Capital Appreciation |
|---|---|---|
| GEORGIA (TBILISI) | 7.5% – 9% | 10% – 12% |
| UAE | 6% – 8% | 5% – 8% |
| INDIA | 3% – 5% | 8% – 10% |
| EUROPE | 4% – 5% | 4% – 5% |
Source Credits: Data compiled from TBC Capital 2025, Knight Frank Global Outlook 2025–2026, Global Property Guide (Q1 2026), JLL India, and PWC Emerging Trends in Real Estate 2026.
Aurra is structured so that investor capital is never exposed without a corresponding hard-asset backstop. Five independent layers of protection ensure your money is secured before a single brick is laid.
3x
Project Value of $4.5M at Completion against $1.5M Invested.
$700K
Freehold land independently valued.
100%
Your full principal is returned before any profit is distributed to the developer.
A first-ranking hypothec on the $700,000 freehold land is registered in the investor's name from Day 1 — before construction begins.
Registered TitleA notarised loan agreement under Georgian law specifying amount, variable interest terms, repayment schedule, and enforcement rights.
Legally Enforceable DebtFunds are disbursed only upon verified construction milestones — certified by the project architect and an independent surveyor.
Phased ReleaseAll funds flow through a dedicated project account. Every disbursement above $25,000 requires both parties' approval.
Investor Co-ControlBuyer deposits flow directly into the project account, progressively reducing the investor's net capital at risk.
Joint Account BufferAll instruments are structured under Georgian law with documentation prepared by Grata International — specialists in Georgian property title and cross-border investment compliance.
Your full principal is returned before any profit is distributed to the developer — regardless of project exit timing.
At 36 months: full loan principal returned first from unit sale proceeds, followed by interest and profit share as units are sold and proceeds accumulate. Terms are fixed at signing — no ambiguity.
Every dollar of investor capital is held in a Project Account and released only upon independently verified construction milestones. No milestone, no release. Below is the exact sequence — from first tranche out to final return.
Released upon Loan Agreement execution and land mortgage registration
Funds are deployed across permit applications, architectural finalisation, engineering design, presales office establishment, and marketing launch. No hard construction capital is committed until the building permit is in hand.
Released upon building permit receipt and independent engineer verification of foundation works
Site cleared, foundation laid, and vertical construction commenced. No funds released until permit is confirmed and foundation works are independently certified.
Released upon structural completion certificate and minimum 20% pre-sales achieved
Phase 1 tower complete to roof level. Building envelope sealed. Pre-sale agreements confirm market demand ahead of fit-out commencement.
No further investor capital deployed from this point.
MEP installation, interior fit-out, and common area completion funded entirely from buyer deposits and construction-phase installments as units are sold. Investor retains full visibility via monthly account statements and dual-signatory control throughout.
Triggered by occupancy certificate issuance and commencement of unit title transfers.
Full loan principal returned first from unit sale proceeds. Interest and profit share distributed thereafter as units are sold and proceeds accumulate. All payouts subject to dual-signatory authorisation.
Dual Verification on Every Release — Every tranche release requires independent certification from both the project architect and a licensed construction engineer. All project account disbursements above USD 25,000 require dual authorisation from both the developer and the investor.
An Economics graduate from Delhi University with 30 years of international trade expertise across Europe and the CIS. A resident of Georgia for 12 years and fluent in Russian, he combines deep local market knowledge with a profound understanding of the Georgian regulatory framework.
"This isn't a project I found on a spreadsheet. I've worked in this region for 12 years. I've seen it grow. I've seen families prosper. And I've watched them look for a home that meets basic modern standards — and come up empty handed."
Appointed for site analysis, preliminary architectural designs and 3D simulations.
Lead architect selection for full project execution currently in progress.
Top Georgian law firm entrusted with the responsibility of investor documentation and regulatory compliance.
Leading Audit Firm of Georgia. Member firm of Moore Global ( UK) - one of the world’s top 10 accounting networks
Contractor appointment will follow permit receipt and will be subject to competitive tender.
Yes — without restriction. Georgia permits foreign individuals and companies to lend capital and hold registered security interests over Georgian real estate under the same terms as Georgian nationals. As a lender, you hold a notarised Loan Agreement and a first-ranking land mortgage registered in your name from Day 1 — enforceable under Georgian law. Apartment titles transfer directly to foreign buyers at handover, typically registered within four business days through Georgia's National Agency of Public Registry.
The minimum ticket is $100,000. Returns are tiered by investment size — larger commitments receive a higher profit share:
| Tier | Investment Range | Profit Share | Annualized Returns |
|---|---|---|---|
| PARTICIPATING | $100,000 — $249,999 | 30% | 13.5% |
| STRATEGIC | $250,000 — $1,000,000 | 35% | 15.75% |
| ANCHOR | $1,500,000 | 40% | 18% |
In addition to the profit share, all tiers may also choose a fixed 10% per annum guaranteed return, or a Hybrid structure combining Cash returns + Unit Allocation. All return options (A, B, C) are available across all tiers.
Five independent layers — no single point of failure:
Base case is $900/sqm, generating $2.0M gross profit on Phase 1's 5,000 sqm sellable area. All returns are USD-denominated. The table below shows annualized returns across four price scenarios:
| Scenario | Stress | Moderate | Base Case | Upside |
|---|---|---|---|---|
| Selling Price | $700/m² | $850/m² | $900/m² | $1000/m² |
| Phase 1 Revenue | $3.5M | $4.25M | $4.5M | $5.0M |
| Phase 1 Profit | $1.0M | $1.75M | $2.0M | $2.5M |
| Anchor Investor Return (40%) | $410,000 profit | $710,000 profit | $810,000 profit | $1,010,000 profit |
| Annualized Returns | 9% | 15.5% | 18% | 22.4% |
The project requires selling at only $450/sqm to cover total costs. Anything above that is profit. Even at the stress-test price, capital is returned in full.
Every identified risk has a pre-agreed, legally enforceable remedy built into the investment agreement from Day 1.
If the project is not completed within 42 months (36-month target + 6-month buffer), the following contractual remedies are available:
Standard exit — Month 36: Full loan principal is returned first from unit sale proceeds, followed by your interest and profit share as units are sold and proceeds accumulate. All capital and returns are due in full by Month 36 at the latest, regardless of sellout status.
Early exit: The Loan Agreement does not provide for unilateral early redemption — your capital is committed for the 36-month project term. However, you may assign or transfer your loan position to a qualified third party at any point during the term, subject to the developer's consent, which cannot be unreasonably withheld. The developer holds a right of first refusal on any such assignment at the independently appraised outstanding loan value.
Sighnaghi is Georgia's premier wine-tourism destination. Aurra Location is 5km from Sighnaghi City center. The existing housing stock is almost entirely Soviet-era construction — no lifts, no secure parking, no modern finishes. Aurra Residences will be the first gated modern complex in this market.
Demand comes from five independent buyer segments: local upgraders escaping Soviet-era stock, Tbilisi second-home buyers, foreign lifestyle investors drawn by 100% freehold rights, buy-to-let investors targeting 7-10% short-term rental yields from Sighnaghi tourism, and returning diaspora.
$900/sqm is in line with comparable Kakheti tourism-adjacent developments. The stress test at $700/sqm — 22% below target — still returns investor capital in full.
Access in-depth financial reports, including full project analysis, investment memorandum, and structured investment opportunities.
Overview of the project
Detailed project economics
Market and demand assumptions
For further information or to discuss participation options, please get in touch with our team today.
We'll get back to you within 24 hours